Distribution sampling & normality tests in Excel
In this tutorial we will:
-
Generate a sample from a Normal distribution and one from a uniform distribution.
-
Perform normality tests on both samples using XLSTAT Cloud.
Dataset for sampling a distribution and running a Normality test
We want to generate two samples, the first one sampled in a Normal N(2,2) distribution (mean = 2, standard deviation (sigma) = 2), the second one in a Uniform distribution, bounded between -1.5 and 5. To do that, we use the Distribution sampling tool available in the Preparing data section.
Setting up the a distribution sampling with XLSTAT Cloud
After opening XLSTAT Cloud, click on Distribution sampling in the Preparing data menu:

The Distribution sampling interface appears.
Select the Theoretical distribution to use and define its parameters.
Then enter the number and the size of the sample to generate.
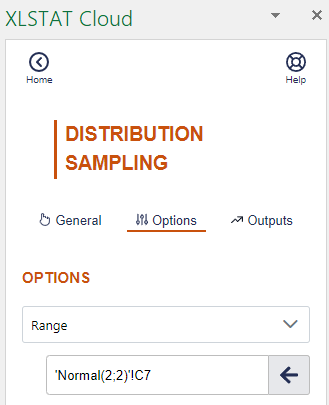
The dialog box displayed below corresponds to the generation of a sample of 1000 cases from a normal N(2,2) distribution.

The computations begin once you have clicked on the Run button, and the sample is then displayed.
A second sample is then generated using a Uniform distribution bounded between -1.5 and 5.

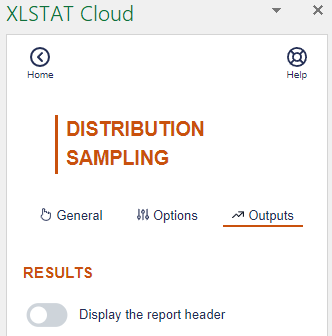
In the Outputs tab, deactivate the Display the report header option. In the Options tab select the cell next to the top of the column associated with the first sample in the field Range. This will allow you to generate the new sample next to the other one
Click on Run in order to display the second sample.
Setting up Normality tests with XLSTAT Cloud
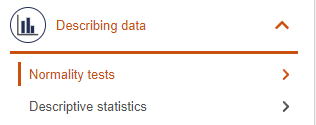
The next step is to test the normality of the two samples. Click on Normality tests in the Describing data menu:
The user interface of Normality tests appears.
Select the two samples in the Data field and activate the Sample labels.

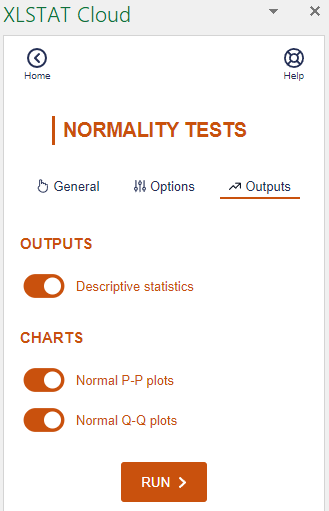
In the Outputs tab, activate the Q-Q plots and P-P plots to visually assess sample normality.
The computations begin once you have clicked on the Run button, and the results are displayed on a new sheet.
Interpreting the results of the Normality test
The results are first displayed for the first sample and then for the second sample.
The first result displayed is the Q-Q plot for the first sample. The Q-Q plot allows to compare the cumulative distribution function (cdf) of the sample (abscissa) to the cumulative distribution function of a theoretical normal distribution with the same mean and standard deviation (ordinates). In the case of samples following a normal distribution, we should observe an alignment with the first bisecting line. In the other cases some deviations from the bisecting line should be observed.
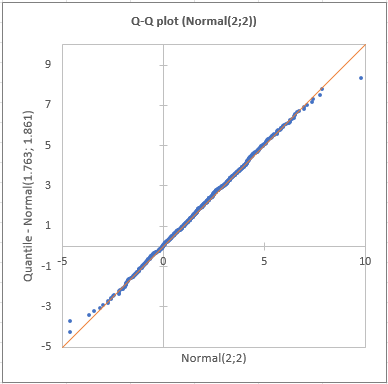
We can see here that the empiric cdf is very close to the bissecting line.

The Shapiro-Wilk and Jarque-Bera tests confirm that we cannot reject the normality assumption for the sample, (p > alpha). We notice that with the Shapiro-Wilk test, the risk of being wrong when rejecting the null assumption is smaller than with the Jarque-Bera test.
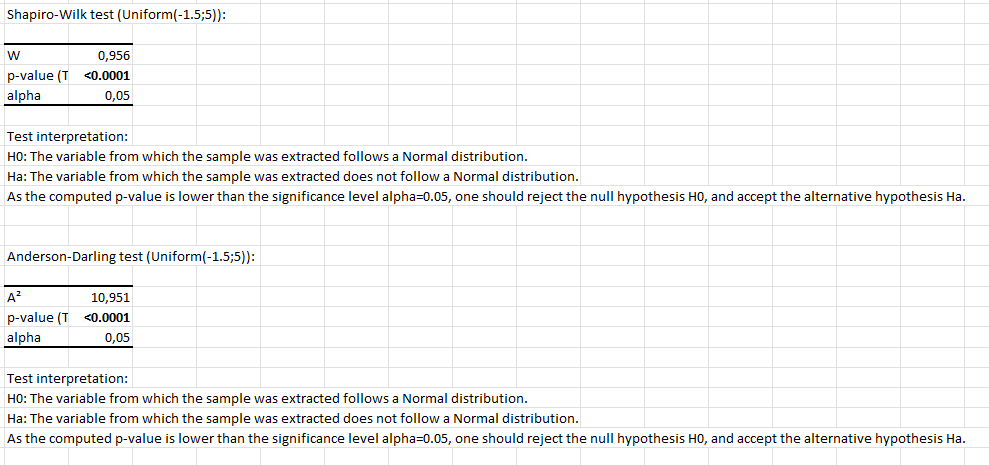
The following results are for the second sample. Contrary to what we observed for the first sample, we notice on the Q-Q plot that there are two strong deviations indicating that the the distribution is most probably not normal.
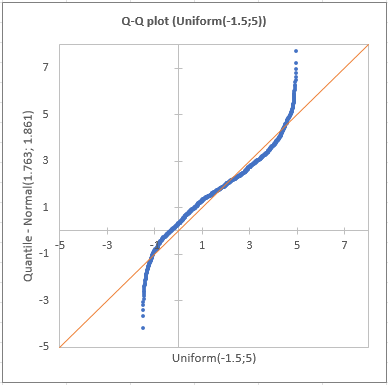
This gap is confirmed by the normality tests (see below) which allow to assert with no hesitation that we need to reject the hypothesis that the sample is normally distributed.
Conclusion
As a conclusion, in this tutorial we have seen how to generate two samples, one following a Normal distribution, the second following a Uniform distribution. We then applied the Jarque-Bera and the Shapiro-Wilk tests on them. These tests did not reject the normality assumption for the first sample, and allowed us to reject it for the second sample.
Please note that none of your data is stored when you use the XLSTAT-Cloud add-in.
¿Ha sido útil este artículo?
- Sí
- No