Run Chi-square and Fisher’s exact tests in Excel
This tutorial will help you set up and interpret Chi-square and Fisher’s exact tests on contingency tables in Excel using the XLSTAT software. Not sure this is the statistical test you are looking for? Check out this guide.
Dataset for running Chi-square and Fisher’s exact tests on contingency tables
For this tutorial we use a contingency table containing counts of a bananas collected on a market stand. The table crosses two qualitative variables: banana variety in columns (3 categories: 1, 2 and 3) and presence of maggots in the banana in rows (two categories: presence, absence). Each cell contains the number of bananas having the combination of the corresponding row and column categories.

Goal of this tutorial on running Chi-square and Fisher’s exact tests on contingency tables
The aim of this tutorial is to use the Chi-square and Fisher exact tests to test the association between two qualitative variables measured on a banana sample: variety and presence/absence of maggots. More details in the paragraph below.
What is the difference between the Chi-square test and Fisher’s exact test on contingency tables?
Conceptually, the Chi-square test and Fisher’s exact test challenge the same null hypothesis, and may thus answer the same question.
H0 (null hypothesis): The two qualitative variables are independent. In our example, this would mean that the presence/absence of maggots is independent of the banana variety. In other words, the ratio of inhabited bananas is the same in all of the three varieties.
Below is a proposition of an alternative hypothesis (two-tailed):
Ha (alternative hypothesis): The two qualitative variables depend on one another. In our example, this would mean that the presence/absence of maggots depends on banana variety. In other words, at least one of the three banana varieties has a ratio of maggot presence which is different from the ratio of the other varieties.
The difference between the two tests lies in the way the p-value is computed.
The Chi-square test is based on the computation of a chi-square statistic which reflects the distance between the real data and theoretical data if the null hypothesis were true (i.e. theoretical frequencies with the same ratios of inhabited bananas across varieties). This statistic is used in a theoretical Chi-square distribution to generate a p-value. The higher the chi-square statistic, the lower the p-value. Notice that XLSTAT allows the computation of theoretical frequencies (see sections below).
Fisher’s exact test computes the probability of having the observed data (using the hypergeometric distribution) as well as the probabilities of getting all of the more extreme possible datasets under the null hypothesis. These probabilities are used to compute Fisher’s exact test p-value.
When theoretical frequencies include frequencies that are lower than 5 or when the dataset’s marginal sums (sums per row or per column) are very uneven, it is better to rely on Fisher’s exact test.
The Chi-square test is more powerful (i.e. more able to reject the null hypothesis when it is false) than Fisher’s exact test.
Setting up Chi-square and Fisher’s exact tests on contingency tables in XLSTAT
Once XLSTAT is opened, go to XLSTAT / Correlation – Association tests / Tests on contingency tables.

In the General tab, make sure that the Contingency table data format is selected, then select your data in the Contingency table field. In the case where your data is organized in a vertical shape (individuals in rows and variables in columns), activate the Qualitative variables data format option. If you wish to transform your data from a vertical format to a contingency table format, this tutorial will guide you.

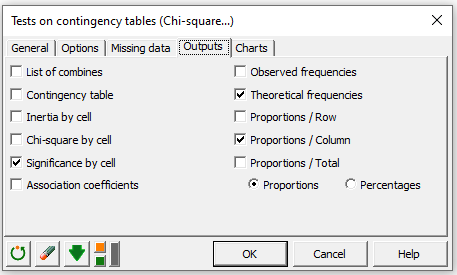
In the Options tab, activate the Chi-square test and Fisher’s exact test options.

Click on the OK button to launch computations. The results appear in a new sheet.
Interpreting the outputs of Chi-square and Fisher’s exact tests on contingency tables in XLSTAT
First, XLSTAT displays the results associated to the Chi-square test. The p-value (0.033) is lower than the significance level of 0.05. Thus, we reject the null hypothesis that maggot presence and banana variety are independent, with a 3.3% risk of being wrong.

Next, Fisher’s exact test results are displayed. Here also, the p-value (0.044) is lower than the significance level 0.05. Fisher’s exact test also leads to a rejection of the null hypothesis.

Notice that the p-value obtained under the Chi-square test is slightly lower than the one associated to Fisher’s exact test. This is the case most of the time, as the Chi-square test is more powerful than Fisher’s exact test.
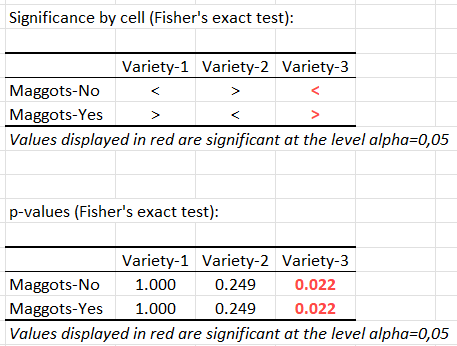
The Significance by cell table indicates, for each cell, if the actual value is equal (=), lower (<) or higher (>) than the theoretical value, and to run a Fisher’s exact test on a 2x2 table in order to determine if the difference with the theoretical value is significant or not. P-values per cell of the contigency table are also provided in a separate table.
Then, the theoretical frequencies table displays frequencies that would have been obtained if the null hypothesis were true. A simple computation shows that the proportion of bananas with maggots is the same across varieties (11.8%). We notice that one of the frequencies is lower than 5. Thus, we prefer not to rely on the Chi-square test’s result, and to report Fisher’s exact test solely.

The Proportions / Column table shows the proportions of Maggots-Yes and Maggots-No bananas for each of the three varieties. According to the result of the tests, we may say that at least one of the (0.121, 0.104 and 0.300) proportions is significantly different from the others.

Was this article useful?
- Yes
- No