Biserial correlations tutorial in Excel
This tutorial shows how to compute a biserial correlation coefficient between a quantitative variable and a binary variable in Excel using XLSTAT.
Dataset to compute biserial correlations
The data used in this tutorial correspond to concentrations of a particular molecule measured in blood samples of 30 mice, split into two different groups depending on their species. We want to use the biserial correlation to check whether there is an association between the concentration and the species. The biserial correlation requires that we have one binary variable and one continuous variable. The variance is assumed to be the same whatever the group to which an observation belongs. The biserial correlation is useful to evaluate the degree of association between a binary (or dichotomous) variable and a continuous variable. Its values range between -1 and 1. 0 corresponds to no association.
Setting up a biserial correlations analysis
-
Open XLSTAT.
-
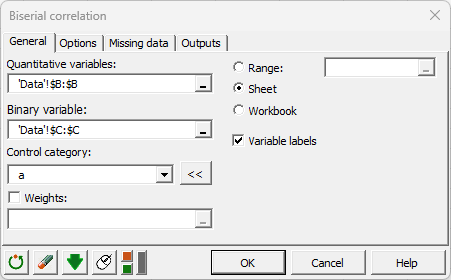
Select the XLSTAT / Describing data / Biserial correlation. The dialog box pops up.
-
In the XLSTAT interface, select the data on the Excel sheet.
-
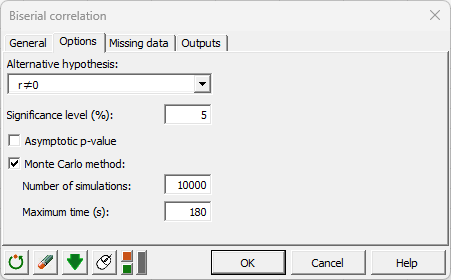
Choose to test whether the biserial correlation is different from 0.
-
Select the Monte Carlo Method.
-
Click on OK.
Interpreting the results of a biserial correlation analysis
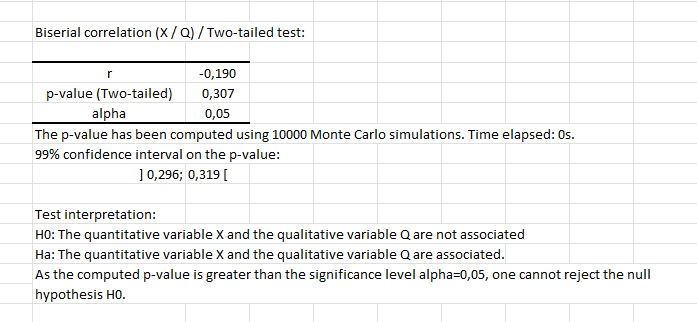
The first table corresponds to basic summary statistics for the various input variables. Then, a table displays the results including the biserial correlation and p-value of the test. We can see here that the correlation is close to zero (0.19) and not significantly different from 0 as the p-value is greater than 0.05.
The biserial correlation can also be computed using the spreadsheet formula XLSTAT_Biserial. The example below shows you how to use it to obtain the biserial correlation coefficient or the corresponding p-value (the example uses the p-value based on the large sample approximation, which is why it is not the same value as above)

Was this article useful?
- Yes
- No